MNIST database, (modified national institute of standards of technology database) is a collection of handwritten 0-9 digit images. It contains training, test and validation dataset, and is a commonly used dataset to train and validate varied image processing and machine learning algorithms.
In the previous post of logistic regression, neural network and TensorFlow introduction, I used a simple {y, x1, x2} dataset. Before my convolution neural network post, I will first introduce the MNIST database.
The database contains 55,000 images in training, 10,000 in test, and 5,000 in validation:
import sys
import matplotlib.pyplot as plt
import numpy as np
from tensorflow.examples.tutorials.mnist import input_data

data = input_data.read_data_sets("../MNIST_data/", one_hot=True)
# check the input data size based on labels
# three data objects: training, test and validation
print("Training size: {}".format(len(data.train.labels)))
print("Test size: {}".format(len(data.test.labels)))
print("Validation size: {}".format(len(data.validation.labels)))
Extracting ../MNIST_data/train-images-idx3-ubyte.gz
Extracting ../MNIST_data/train-labels-idx1-ubyte.gz
Extracting ../MNIST_data/t10k-images-idx3-ubyte.gz
Extracting ../MNIST_data/t10k-labels-idx1-ubyte.gz
Training size: 55000
Test size: 10000
Validation size: 5000
Each data object contains “images”, and “labels”. The label shows the true digit of the image.
# inside each training/test/validation
# it contains one-hot array for image vector, and labels
print(dir(data.train))
['__class__', '__delattr__', '__dict__', '__dir__', '__doc__', '__eq__',
'__format__', '__ge__', '__getattribute__', '__gt__', '__hash__',
'__init__', '__init_subclass__', '__le__', '__lt__', '__module__',
'__ne__', '__new__', '__reduce__', '__reduce_ex__', '__repr__',
'__setattr__', '__sizeof__', '__str__', '__subclasshook__',
'__weakref__', '_epochs_completed', '_images', '_index_in_epoch',
'_labels', '_num_examples', 'epochs_completed', 'images', 'labels',
'next_batch', 'num_examples']
I imported the data as one-hot, and the 2D 28*28 pixels image has been flatten into one vector with length 784.
print(data.train.labels[0:5])
print(data.train.images[0:5])
print(np.shape(data.train.images[0:5]))
[[ 0.  0.  0.  0.  0.  0.  0.  1.  0.  0.]
 [ 0.  0.  0.  1.  0.  0.  0.  0.  0.  0.]
 [ 0.  0.  0.  0.  1.  0.  0.  0.  0.  0.]
 [ 0.  0.  0.  0.  0.  0.  1.  0.  0.  0.]
 [ 0.  1.  0.  0.  0.  0.  0.  0.  0.  0.]]

[[ 0.  0.  0. ...,  0.  0.  0.]
 [ 0.  0.  0. ...,  0.  0.  0.]
 [ 0.  0.  0. ...,  0.  0.  0.]
 [ 0.  0.  0. ...,  0.  0.  0.]
 [ 0.  0.  0. ...,  0.  0.  0.]]

(5, 784)
As shown above, the label is a 1-D vector for each image, with the index of maximum value as the true digit. We can further get true label using argmax function:
# change labels from 2D array to a vector
data.train.trues = np.array([label.argmax() for label in data.train.labels])
print(data.train.trues[0:5])
[7 3 4 6 1]
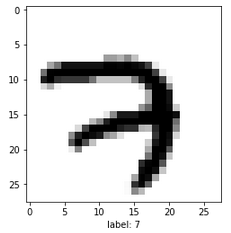
Plot the first digit image:
import matplotlib
matplotlib.rcParams['figure.figsize'] = (5.0, 5.0)
# test print one image
index1 = 0
# image size is 28*28 pixels
img_size = 28
img_shape = (img_size, img_size)

plt.imshow(data.train.images[index1].reshape(img_shape), cmap="binary")
plt.xlabel("label: {}".format(data.train.trues[index1]))
plt.show()

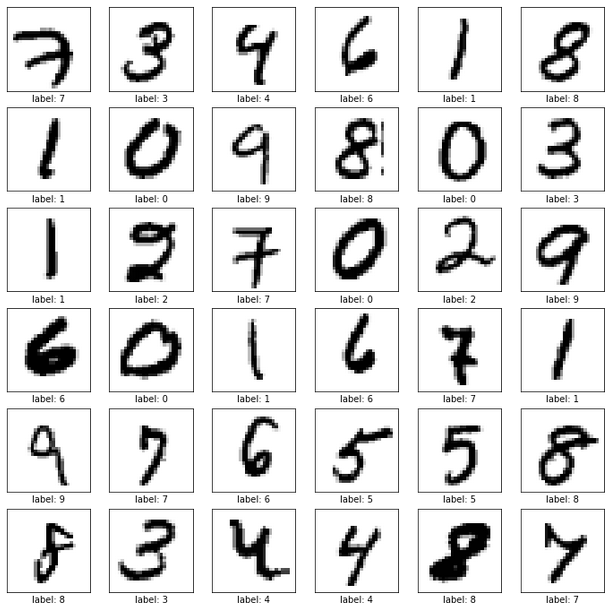
Print the first 36 images:
import matplotlib
%matplotlib inline
matplotlib.rcParams['figure.figsize'] = (12.0, 12.0)

grid_size=6

fig, axes = plt.subplots(grid_size, grid_size)
fig.subplots_adjust(hspace=0.2, wspace=0.2)

for i, ax in enumerate(axes.flat):
    ax.imshow(data.train.images[i].reshape(img_shape), cmap='binary')
    ax.set_xlabel("label: {}".format(data.train.trues[i]))
    ax.set_xticks([])
    ax.set_yticks([])

plt.show()

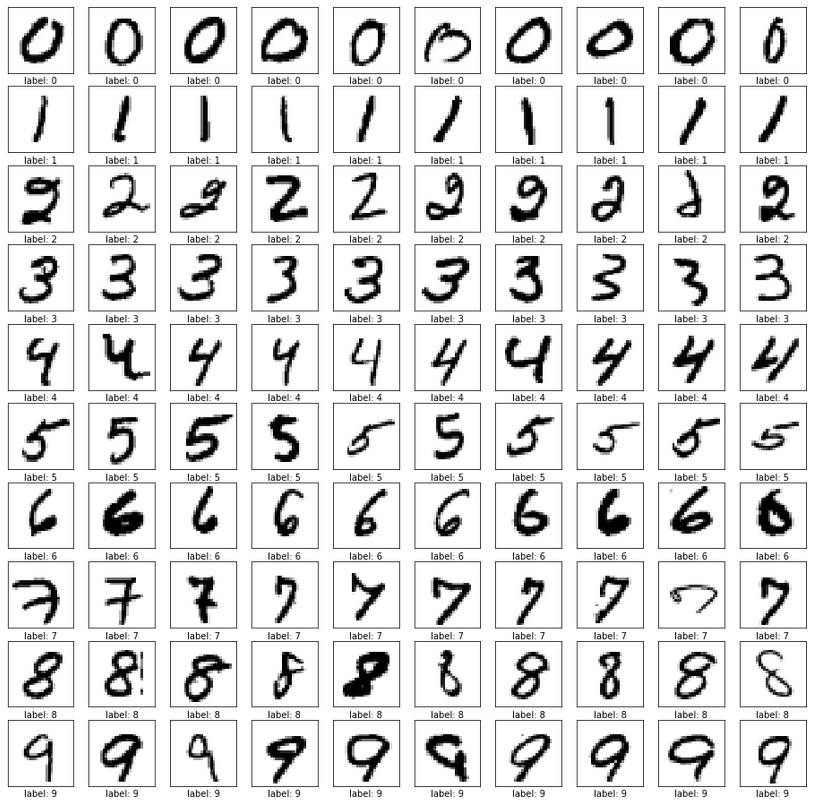
Print the first 10 images for each digit:
import matplotlib
matplotlib.rcParams['figure.figsize'] = (16.0, 16.0)
grid_size=10

fig, ax = plt.subplots(grid_size, grid_size)
fig.subplots_adjust(hspace=0.2, wspace=0.2)

# print 10 examples for each 0-9 case
for i in np.arange(grid_size):
    # find the value i in the first 500 images
    item_index = np.where(data.train.trues[0:500]==i)
    item_index = item_index[0]
    for j in np.arange(grid_size):
        im_index = item_index[j]
        ax[i, j].imshow(data.train.images[im_index].reshape(img_shape), cmap='binary')
        ax[i, j].set_xlabel("label: {}".format(data.train.trues[im_index]))
        ax[i, j].set_xticks([])
        ax[i, j].set_yticks([])


plt.show()
